 Colouring Nest
Multiplication Chart 1–10
- Ages 6–9
- Easy
- 1 page
- Maths chart
- PDF: Letter & A4

Tip: tap a color, then tap any shape to fill it (or use the arrow keys and Enter). Your coloring is saved on this device automatically. To color on paper, download the Letter or A4 PDF and print it at 100%.
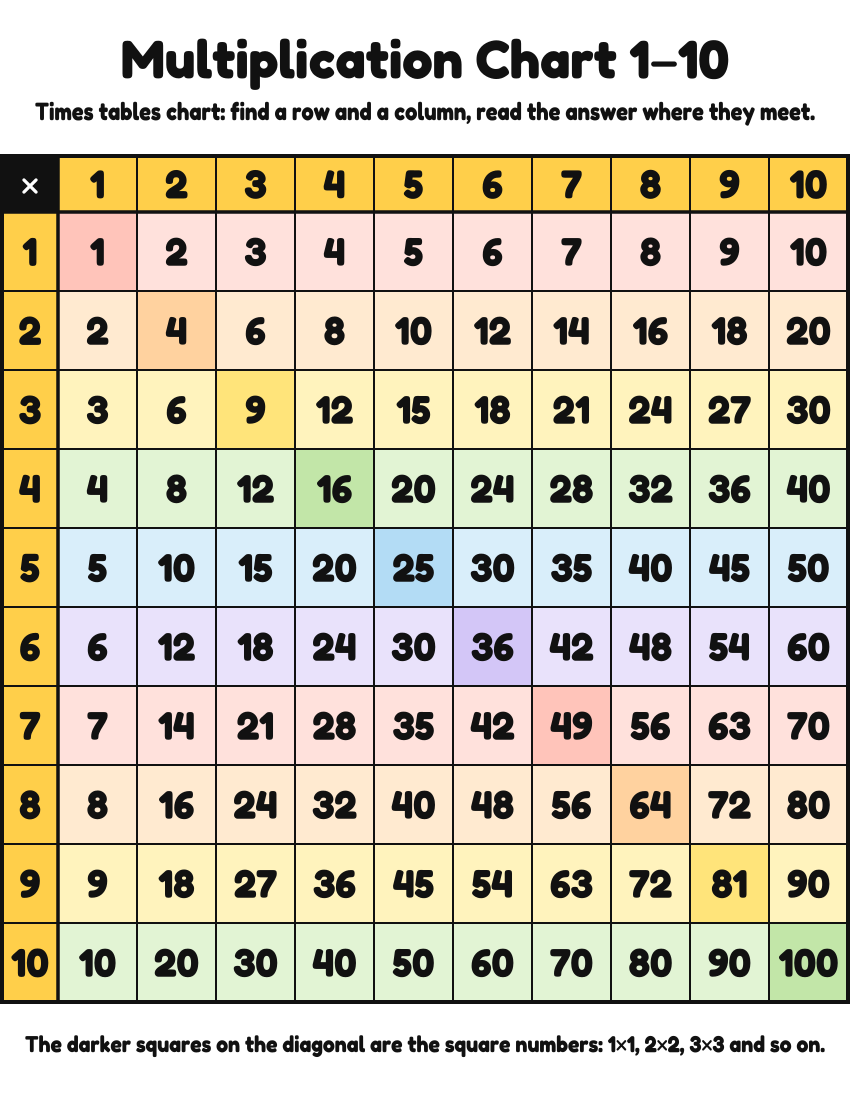
Up nextMultiplication Chart 1–12 →The 1–10 chart has the 100 basic facts, from 1 × 1 to 10 × 10. It is the place to start: big squares, numbers no bigger than 100, and patterns that are easy to spot, like the 5s ending in 5 or 0 and the 10s ending in 0. Each row has its own soft colour so a finger can follow it across, and the square numbers (1 × 1, 2 × 2, 3 × 3 and so on) are a darker shade on the diagonal.
Also try: Blank Multiplication Chart 1–12 · 7 Times Table · 2 Times Table
Using this times tables chart in maths
This chart covers the 10 × 10 grid, 100 facts in all. Some ways to use it:
- Find a fact: put one finger on 7 in the left column and one on 8 in the top row, slide them together, and read 56.
- Spot the square numbers on the diagonal: 1, 4, 9, 16, 25, 36 up to 100.
- Fold the chart along the diagonal: both halves match, because 3 × 4 = 4 × 3.
For teachers and parents
- What it practises
- Multiplication facts, reading a grid by row and column, spotting number patterns
- How to use it
- Keep the chart beside a worksheet for checking answers, or use it to look for patterns: the diagonal of square numbers, the 5s ending in 5 or 0, and the two halves that match.
- Time
- About 5–15 minutes
More multiplication charts


See all multiplication charts →
You might also like


Printing tips
- Print at 100% (actual size) so the squares keep their size; the PDFs are already set up for Letter and A4.
- Slip a chart into a plastic sleeve and use a dry-erase marker to circle facts, then wipe it clean.
- Choose the black and white chart to save colour ink; it uses no grey fills.